
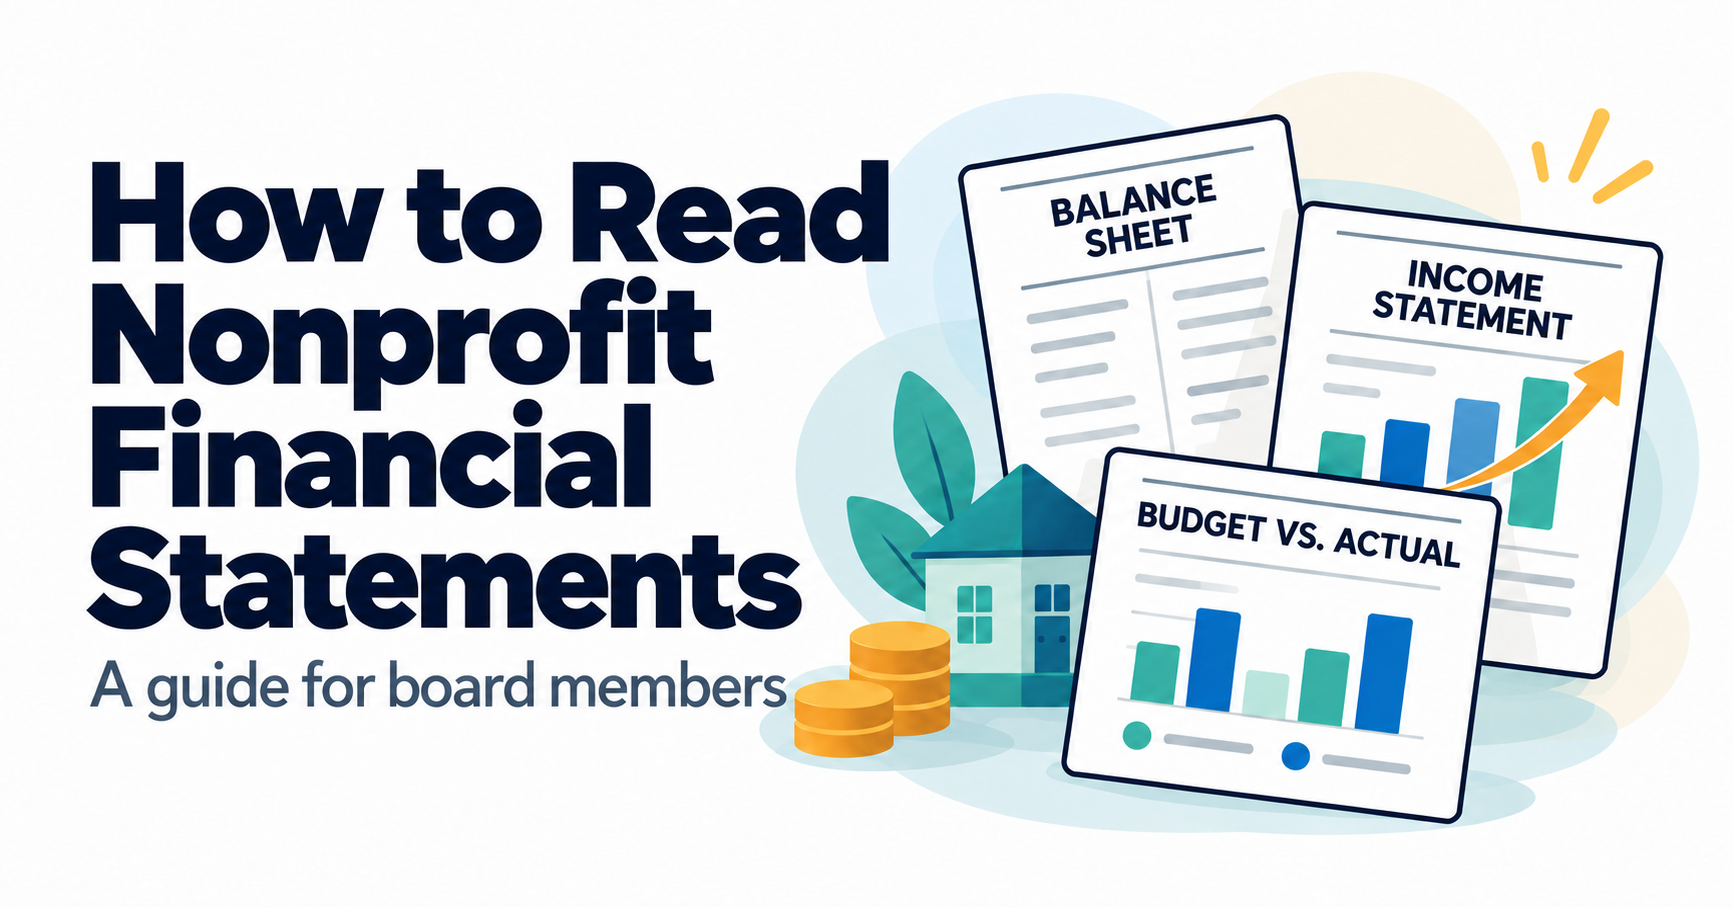
You joined the board because you care about the mission. Then the first board packet lands in your inbox, and there it is: a stack of spreadsheets full of numbers, parentheses, and terms like “net assets with donor restrictions.”
Let’s be honest. Most board members look at those pages, nod along when the treasurer presents, and quietly hope someone else caught anything important. You’re not alone, and you’re not the problem. Nobody teaches volunteers how to read nonprofit financial statements, yet financial oversight is one of the most important jobs a board has.
Here’s the good news: you don’t need an accounting degree. You need to know which three reports matter most, where to look on each one, and what questions to ask. That’s what this guide covers, with sample statements you can follow along with.
Why Financial Literacy Is Part of Your Job
Every nonprofit board member carries a duty of care, which means making informed decisions through active participation. Reviewing financial reports is a core part of that. As BoardSite’s Board Training Resources point out, “rubber stamping” without review and not reading financial reports are two of the most common mistakes board members make.
You’re not expected to audit the books. You are expected to understand the big picture well enough to spot trouble, ask good questions, and make sound decisions about the organization’s future.
The Three Reports Every Board Member Should Know
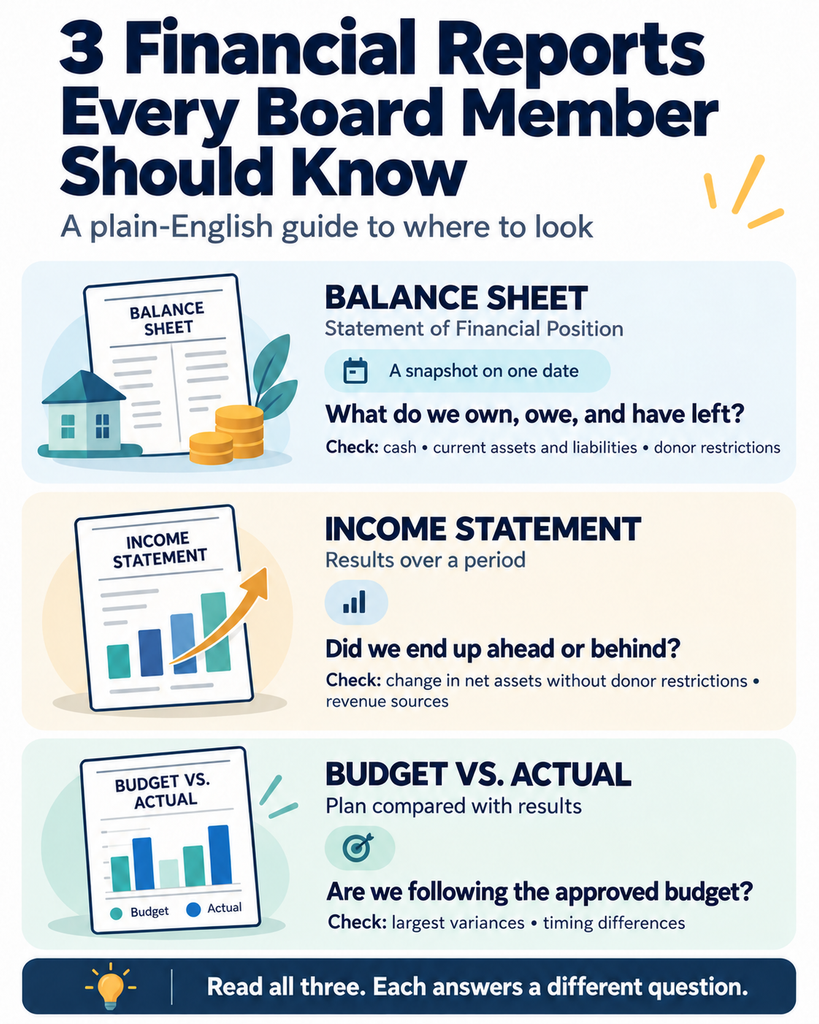
For most nonprofit boards, and especially for new board members, three financial reports come up again and again:
- The Balance Sheet (called the Statement of Financial Position for nonprofits)
- The Profit and Loss Statement (called the Income Statement or Statement of Activities for nonprofits)
- The Budget vs. Actual Report
Think of them this way. The balance sheet is a snapshot of where the organization stands on a single day. The statement of activities is the story of what happened over a period of time. The budget vs. actual report compares that story to the plan the board approved.
To make each one concrete, we’ll walk through a sample of each statement for a fiscal year ending June 30, 2026.
Report #1: The Balance Sheet (Statement of Financial Position)
What it answers: What do we own, what do we owe, and what’s left over?
The balance sheet follows one simple equation:
Assets minus Liabilities = Net Assets
In a for-profit business, “net assets” would be called equity or owner’s equity. Nonprofits don’t have owners, so the leftover value belongs to the organization and its mission.
Sample Statement of Financial Position
Statement of Financial Position As of June 30, 2026
| ASSETS | |
|---|---|
| Cash and cash equivalents | $185,000 |
| Accounts receivable | $12,000 |
| Grants and pledges receivable | $60,000 |
| Prepaid expenses | $8,000 |
| Inventory | $25,000 |
| Total current assets | $290,000 |
| Property and equipment, net | $310,000 |
| TOTAL ASSETS | $600,000 |
| LIABILITIES | |
| Accounts payable | $22,000 |
| Accrued payroll | $18,000 |
| Deferred revenue | $10,000 |
| Current portion of long-term debt | $15,000 |
| Total current liabilities | $65,000 |
| Long-term debt, less current portion | $135,000 |
| TOTAL LIABILITIES | $200,000 |
| NET ASSETS | |
| Without donor restrictions | $320,000 |
| With donor restrictions | $80,000 |
| TOTAL NET ASSETS | $400,000 |
| TOTAL LIABILITIES AND NET ASSETS | $600,000 |
Where to Look First
Cash. Start at the top. How much cash does the organization have right now? In the sample, that’s $185,000.
Current assets vs. current liabilities. “Current” means cash or items expected to turn into cash (or come due) within about a year. The sample shows $290,000 in current assets and $65,000 in current liabilities. Divide the first by the second and you get a current ratio of about 4.5. In plain terms, the organization has roughly $4.50 available for every $1 it owes in the near term. A ratio below 1.0 is a warning sign that the organization may struggle to pay its bills on time.
Net assets, split by restriction. This line trips up almost every new board member, so it’s worth slowing down:
- Net assets without donor restrictions can be used for any purpose that supports the mission, including rent, salaries, and keeping the lights on.
- Net assets with donor restrictions come with strings attached. A donor or funder has said the money must be used for a specific program, a specific time period, or both.
Total net assets in the sample look healthy at $400,000. But $80,000 of that is restricted, and a big chunk of the unrestricted amount is tied up in property and equipment. The building is valuable, but you can’t use it to make payroll.
A Quick Health Check: Months of Cash on Hand
One of the most useful numbers a board member can calculate takes about 30 seconds:
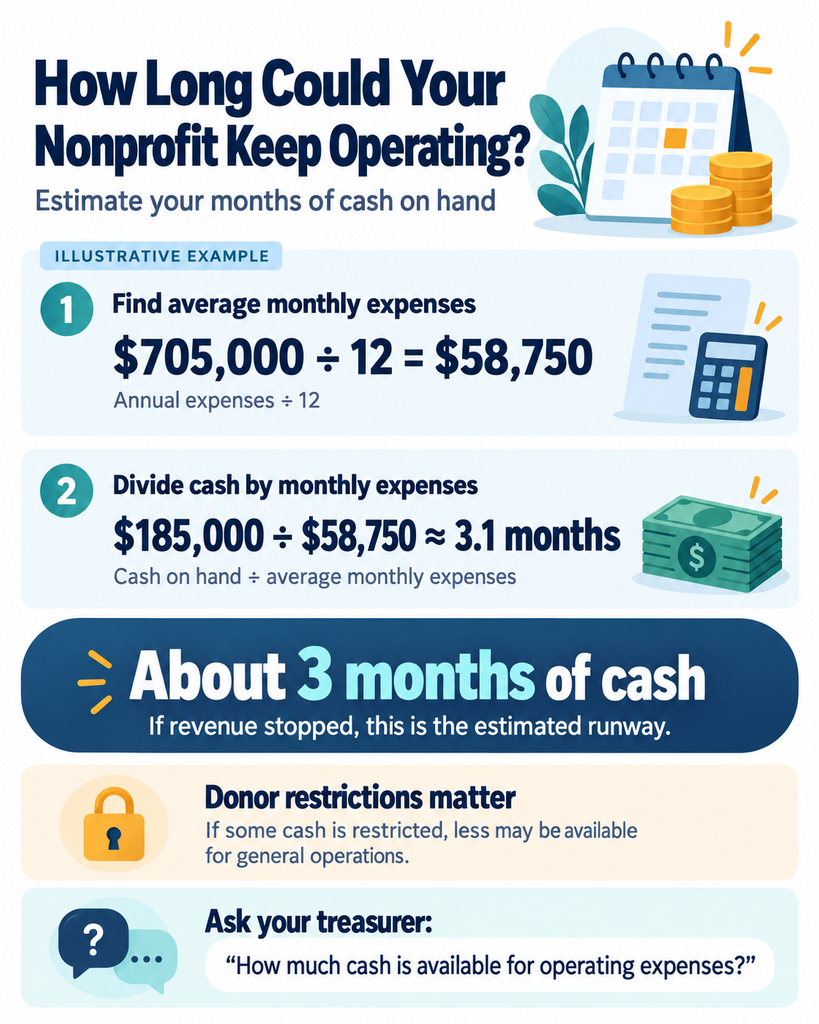
- Take total annual expenses (you’ll find this on the statement of activities below): $705,000
- Divide by 12 to get average monthly expenses: about $58,750
- Divide cash on hand by monthly expenses: $185,000 ÷ $58,750 = about 3.1 months
If every dollar of revenue stopped tomorrow, this organization could operate for roughly three months. If some of that cash is restricted, the real number is lower. Many boards set a target operating reserve in their financial policies, and BoardSite’s free Financial Dashboard template uses six months as its benchmark.
Board Member Tip: Ask your treasurer how much of the cash balance is restricted. That one question tells you how much flexibility the organization really has.
Report #2: The Profit and Loss Statement (Income Statement)
What it answers: Over the past period, how much money came in, how much went out, and did we end up ahead or behind?
A business calls the bottom line “net income” or “profit.” Nonprofits call it the change in net assets. And yes, nonprofits can (and should) aim for a modest surplus. Ending the year ahead is how an organization builds the reserves that carry it through lean times.
Sample Income Statement
Profit & Loss Statement For the Year Ended June 30, 2026
| Without Donor Restrictions | With Donor Restrictions | Total | |
|---|---|---|---|
| REVENUE AND SUPPORT | |||
| Individual contributions | $310,000 | $40,000 | $350,000 |
| Foundation grants | $90,000 | $100,000 | $190,000 |
| Government grants | $150,000 | $0 | $150,000 |
| Special events (net) | $45,000 | $0 | $45,000 |
| Program service fees | $20,000 | $0 | $20,000 |
| Net assets released from restrictions | $110,000 | ($110,000) | $0 |
| Total revenue and support | $725,000 | $30,000 | $755,000 |
| EXPENSES | |||
| Program services | $540,000 | $540,000 | |
| Management and general | $95,000 | $95,000 | |
| Fundraising | $70,000 | $70,000 | |
| Total expenses | $705,000 | $705,000 | |
| CHANGE IN NET ASSETS | $20,000 | $30,000 | $50,000 |
| Net assets, beginning of year | $300,000 | $50,000 | $350,000 |
| NET ASSETS, END OF YEAR | $320,000 | $80,000 | $400,000 |
Notice that the ending net assets ($400,000) match the balance sheet exactly. That’s by design. The statement of activities explains how the organization got from last year’s balance sheet to this year’s.
Where to Look First
The bottom line, by column. The total change in net assets in the sample is a positive $50,000. That sounds great, but look closer. Only $20,000 of the surplus is unrestricted. The other $30,000 is restricted money that has come in but can’t be spent freely yet. Always check the “without donor restrictions” column to see whether day-to-day operations actually ran a surplus or a deficit.
Parentheses mean negative. Accountants rarely use minus signs. When you see ($110,000), read it as negative $110,000.
“Net assets released from restrictions.” This line looks strange at first. It simply shows restricted money being put to work. When the organization spends a restricted grant on the program it was intended for, the money moves out of the restricted column and into the unrestricted column. It’s a transfer, not new revenue, which is why the total is $0.
Revenue concentration. Where does the money come from? In the sample, individual donors provide 46% of revenue ($350,000 of $755,000), foundations 25%, and government grants 20%. If a single source makes up a large share of revenue, ask what would happen if it went away.
Expenses by function. Nonprofits sort expenses into three buckets:
- Program services: the work that directly delivers the mission
- Management and general: administration, finance, HR, and governance
- Fundraising: the cost of raising contributions
The sample shows $540,000 of $705,000 spent on programs, a program expense ratio of about 77%. Donors, grantmakers, and charity watchdogs often look at this ratio. That said, it isn’t the whole story. An organization that underinvests in management and fundraising can struggle to sustain its programs over time, so treat the ratio as a conversation starter rather than a grade.
Board Member Tip: Compare this year’s statement of activities to last year’s. A single year tells you what happened. Two or three years side by side tell you where the organization is heading.
Report #3: The Budget vs. Actual Report
What it answers: Are we following the plan the board approved?
The board approves the annual budget, which makes the budget vs. actual report the most direct way to hold the organization accountable to its own plan. Most boards see this report at every meeting, often prepared year-to-date. Unlike the formal financial statements, there’s no standard format, so yours may look a little different. The core idea is always the same: what we planned next to what actually happened.
Sample Budget vs. Actual Report
Budget vs. Actual For the Year Ended June 30, 2026
| Budget | Actual | Variance Fav/(Unfav) | % of Budget | |
|---|---|---|---|---|
| REVENUE | ||||
| Individual contributions | $330,000 | $350,000 | $20,000 | 106% |
| Foundation grants | $220,000 | $190,000 | ($30,000) | 86% |
| Government grants | $150,000 | $150,000 | $0 | 100% |
| Special events (net) | $60,000 | $45,000 | ($15,000) | 75% |
| Program service fees | $20,000 | $20,000 | $0 | 100% |
| Total revenue | $780,000 | $755,000 | ($25,000) | 97% |
| EXPENSES | ||||
| Salaries and benefits | $430,000 | $425,000 | $5,000 | 99% |
| Program supplies | $110,000 | $128,000 | ($18,000) | 116% |
| Occupancy | $60,000 | $58,000 | $2,000 | 97% |
| Vehicle and delivery | $35,000 | $41,000 | ($6,000) | 117% |
| Professional fees | $25,000 | $22,000 | $3,000 | 88% |
| Other operating | $30,000 | $31,000 | ($1,000) | 103% |
| Total expenses | $690,000 | $705,000 | ($15,000) | 102% |
| NET SURPLUS | $90,000 | $50,000 | ($40,000) |
Where to Look First
The variance column. This is where the story lives. A favorable variance means revenue came in higher or expenses came in lower than planned. An unfavorable variance, shown in parentheses, means the opposite.
Big variances, not every variance. Don’t get lost in a $1,000 miss on office supplies. Focus on the lines that move the bottom line. In the sample, four items explain almost everything:
- Foundation grants came in $30,000 short. Was a grant delayed, reduced, or lost?
- The special event raised $15,000 less than planned. Was the goal realistic, or did something go wrong?
- Program supplies ran $18,000 over budget. Did demand increase, did prices rise, or both?
- Vehicle and delivery costs came in 17% over budget. Is this connected to higher program activity?
The organization still ended the year with a $50,000 surplus, but that’s $40,000 less than the board planned. None of these variances is a crisis on its own. Together, they’re exactly the kind of pattern a board should discuss before approving next year’s budget.
Timing matters on year-to-date reports. If you’re reviewing a mid-year report, remember that revenue doesn’t always arrive evenly. A large grant payment or an annual gala can make a line look far behind in March and right on target by June. Ask whether a variance is a real problem or just a timing difference.
Board Member Tip: Ask for a short written explanation of any variance above a set threshold, such as 10% or $5,000. It saves meeting time and gets everyone focused on the numbers that matter.
Other Reports You May See
The three reports above will carry you through most board meetings. As you get more comfortable, you may also run into:
- Statement of Cash Flows: tracks how cash actually moved in and out, which can differ from revenue and expenses on the statement of activities
- Statement of Functional Expenses: breaks down each type of expense (salaries, rent, supplies) across program, management, and fundraising
- Audited Financial Statements and Notes: the formal year-end statements, reviewed by an independent auditor, with notes explaining the numbers
- IRS Form 990: the annual information return that most tax-exempt organizations file, which is available to the public
If your organization has an audit committee, BoardSite’s free Audit Committee Checklist covers what to review before, during, and after the audit.
10 Questions Every Board Member Can Ask
You don’t need to have the answers. You just need to ask good questions. Here are 10 you can bring to your next meeting:
- How many months of operating expenses could we cover with the cash we have today?
- How much of our cash is restricted, and for what?
- Are we running a surplus or a deficit in unrestricted operations?
- Which revenue sources are we most dependent on, and what’s our plan if one declines?
- What’s driving our largest budget variances?
- Are any variances timing differences, or do they signal a real change?
- Are we paying our bills on time? Is anything past due?
- How do this year’s results compare to last year’s?
- Are there any grants or restricted gifts we’re at risk of not spending as the funder intended?
- What financial risks should the board be aware of that aren’t visible in these reports?
A healthy finance team welcomes these questions. If asking them feels unwelcome, that’s worth noting too.
Red Flags Worth a Closer Look
Most variances have a perfectly reasonable explanation. Still, some patterns deserve a follow-up conversation:
- Cash declining month after month without a clear plan
- Current liabilities approaching or exceeding current assets
- Multiple years of deficits in the “without donor restrictions” column
- Restricted funds being used to cover general operating costs
- Financial reports that arrive late, change format often, or are missing entirely
- Repeated, unexplained budget variances in the same line items
Strong internal controls help prevent many of these problems. BoardSite’s Internal Controls Checklist and Financial Oversight Policy templates are good starting points if your board hasn’t formalized these practices yet.
A 15-Minute Pre-Meeting Routine
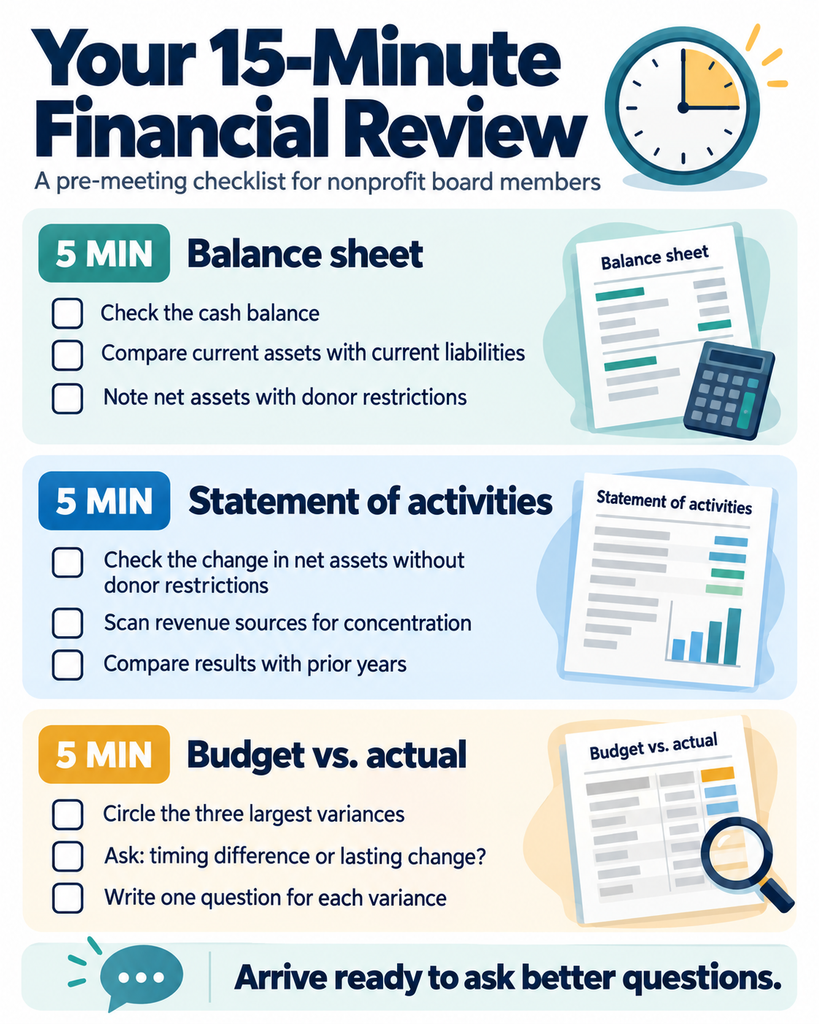
Here’s a simple routine you can follow every time a financial report lands in your board packet:
- Balance sheet (5 minutes): Check cash, compare current assets to current liabilities, and note how much of net assets is restricted.
- Statement of activities (5 minutes): Read the bottom line in the “without donor restrictions” column and scan revenue by source.
- Budget vs. actual (5 minutes): Circle the three largest variances and jot down one question about each.
That’s it. Fifteen minutes of preparation turns you from a passive listener into a board member who adds real value to the financial discussion.
Make Financial Oversight Easier with BoardSite
Reading the reports is only half the battle. Your board also needs to get them on time, find them later, and discuss them in a secure space.
BoardSite’s Document Library keeps every financial report organized in one place, so new board members can review past statements and spot trends without digging through old email attachments. The Meeting Viewer gives directors easy access to the full board packet before each meeting, and Committee pages give your finance and audit committees their own dedicated workspace and document libraries.
When questions come up between meetings, board members can raise them in threaded Discussions instead of scattered email chains. When it’s time to approve the annual budget, Online Voting creates a clean record of every decision. And because financial information is sensitive, BoardSite includes enterprise security with document watermarking, audit trails, and encryption in every plan.
Want to build your governance skills further? Explore BoardSite Academy for board governance training, download the free Nonprofit Budget Template and Financial Dashboard, or read The Board Meeting Playbook for more ways to run productive meetings.
Empower Your Board Now
Financial statements don’t have to be intimidating. Once you know where to look and what to ask, you’ll be one of the most valuable voices in the room.
BoardSite gives your board one secure place for financial reports, meeting materials, and decisions, start at $149/month now or free for teams up to 10.
Start Your Free Trial or Request a Demo to see how BoardSite can support your board’s financial oversight.
This article is intended for general educational purposes and is not accounting, legal, or tax advice. Financial statement formats vary by organization. Consult your treasurer, finance staff, or a qualified accountant with questions about your organization’s specific statements.
[boardsite_article_endmatter]